Data Reporting lab monitoring and alarm system
XiltriX data reporting and lab monitoring is very complete. The system offers one-click options for graphs, numerical values and statistical overviews. Graphical reporting can be automated using the scripting tool built into the software. Reports will provide easy and quick results for companies that have to create for example monthly printouts of sensors/devices that need to be saved or sent to clinical partners.
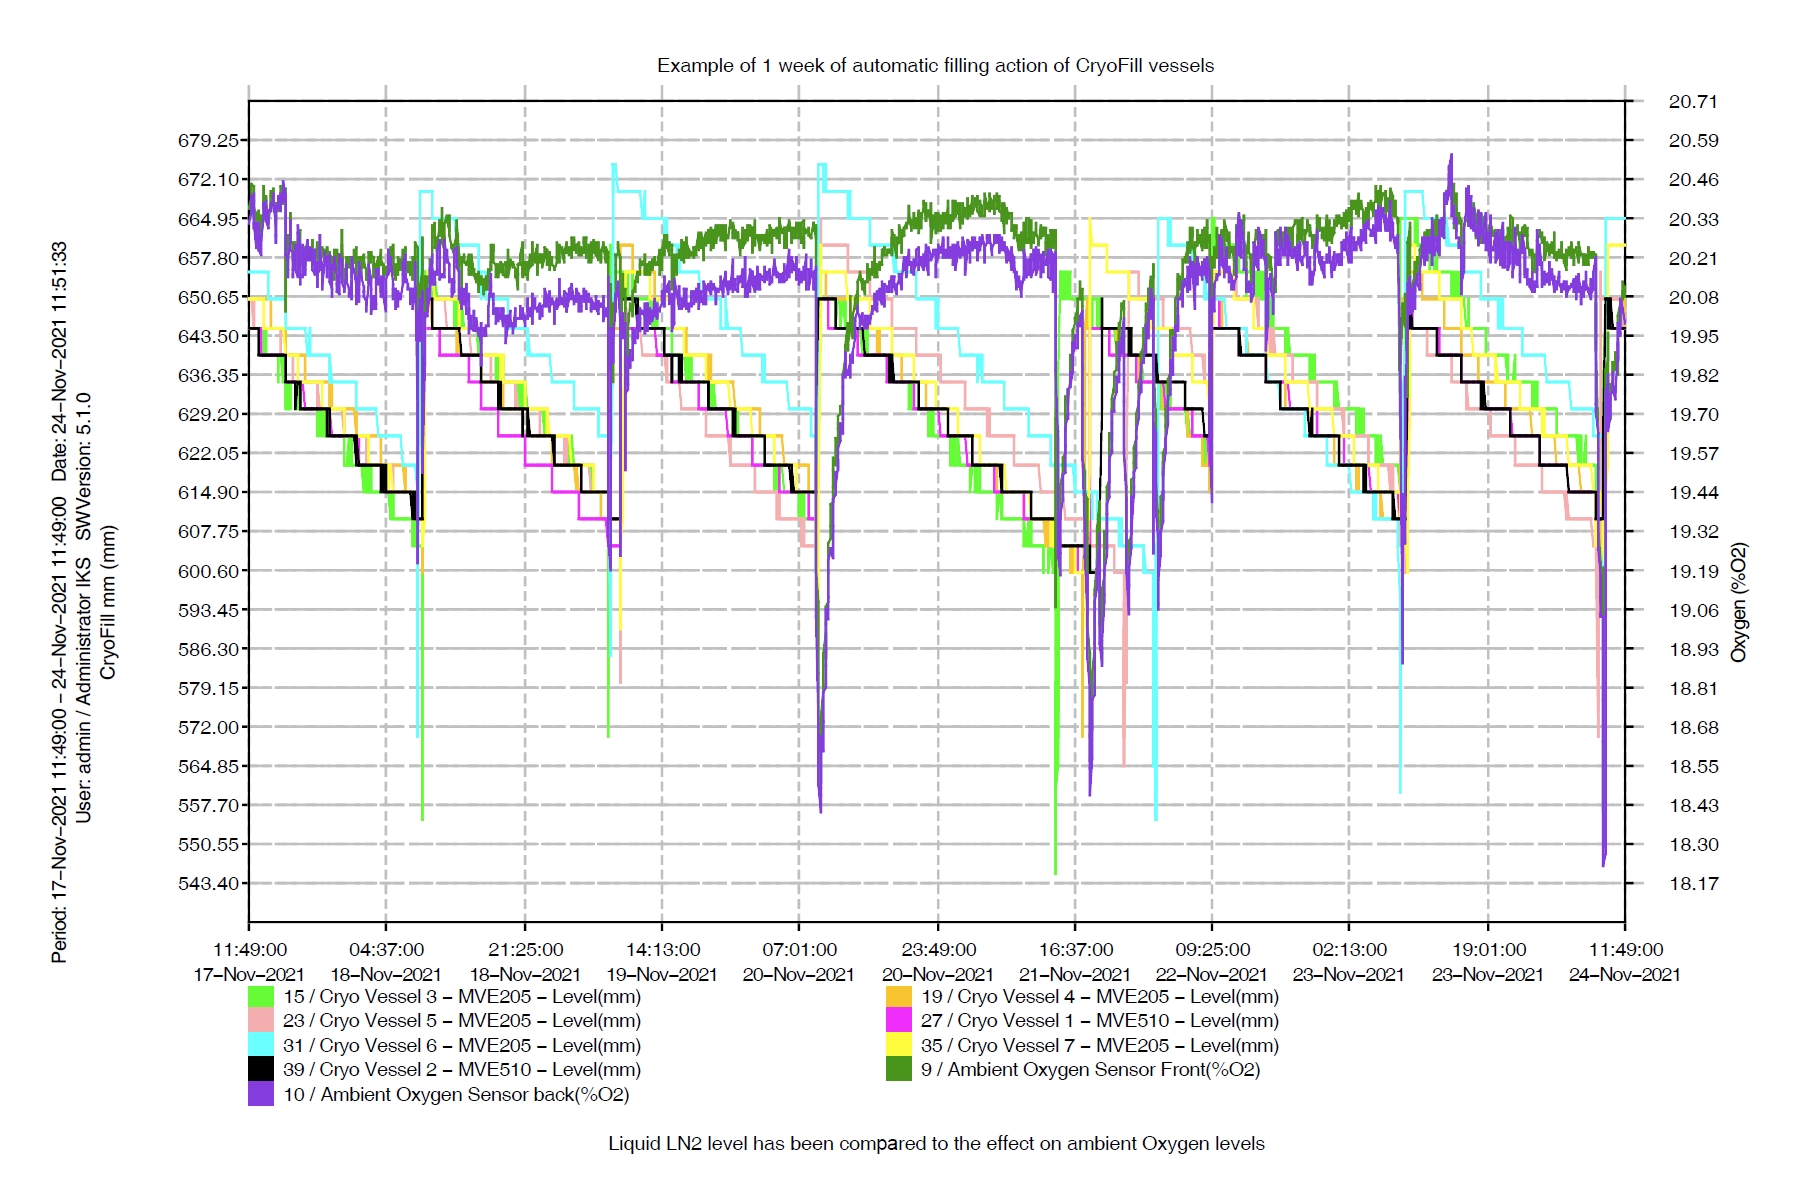
If used as a quality control tool, XiltriX data will actually show devices performance deteriorating before they break down permanently. This allows for PRO-ACTIVE response preventing incidents instead of fixing them. Examples of these reports are shown below.
XiltriX offers our users full reporting capabilities:
- Zoomable historical graphs/reports generated in seconds
- Graphs, numerical values and statistical information from any sensor at any time
- Up to 10 parameters displayed simultaneously for easy comparison and trend analysis
- 2 different parameters can be overlayed in time
- Export of all numerical and statistical data to MS Excel™ compatible files
- Statistics including all commonly used values e.g. MKT (Mean Kinetic Temperature)
If you would like to know more about XiltriX, let me know.

Han Weerdesteyn
CCO
XiltriX. Protecting your Science
24-hours a day, 7-days a week.

Case Study – Erasmus MC Central Biobank relies on XiltriX for Risk Mitigation
The Central Freezer Facility started in the Erasmus MC in Rotterdam started with 56 Nordic Freezers containing up to 164.640 samples.

Case Study – XiltriX partnering with IVF Group Ferty9 Fertility Center, India
The Ferty9 IVF group has taken the next steps in optimizing quality by installing XiltriX cloud monitoring in the Kukatpally lab, India.

XiltriX at Laborama 2024 – Brussel Expo – Hall 3, Booth G18
XiltriX International is happy to join into the 24th edition of the Laborama, The main event for the laboratory industry, taking place on 14 & 15 March.


